You found a property that looks like a good deal. The numbers pencil out on paper. The purchase price seems low enough, the renovation estimate seems reasonable, and the ARV makes the spread look profitable. You even found a lender to fund it.
Then you close on the purchase, finish the rehab, relist it, and nothing happens.
No showings. No offers. Sixty days on market turns into ninety. Your carrying costs are eating into profit that barely existed in the first place. The property seemed fine. The renovations were nicely done. Maybe the NEIGHBORHOOD was the problem.
I have watched this happen hundreds of times with many other Maryland real estate investors. The number one mistake is not knowing the property value and failing to properly analyze the neighborhood before writing the check.
This is the exact framework I use when underwriting deals. A methodology you can apply to ANY Maryland neighborhood to determine whether it has real flipping potential or just looks good on a spreadsheet.
What This Article Covers
- Comparable Sales Density: The Foundation of Your ARV
- Days on Market Trends: Reading the Velocity
- Price Trajectory Over 12 to 24 Months
- Absorption Rate: How Fast Is Inventory Moving
- Rental Demand as Your Backup Exit Strategy
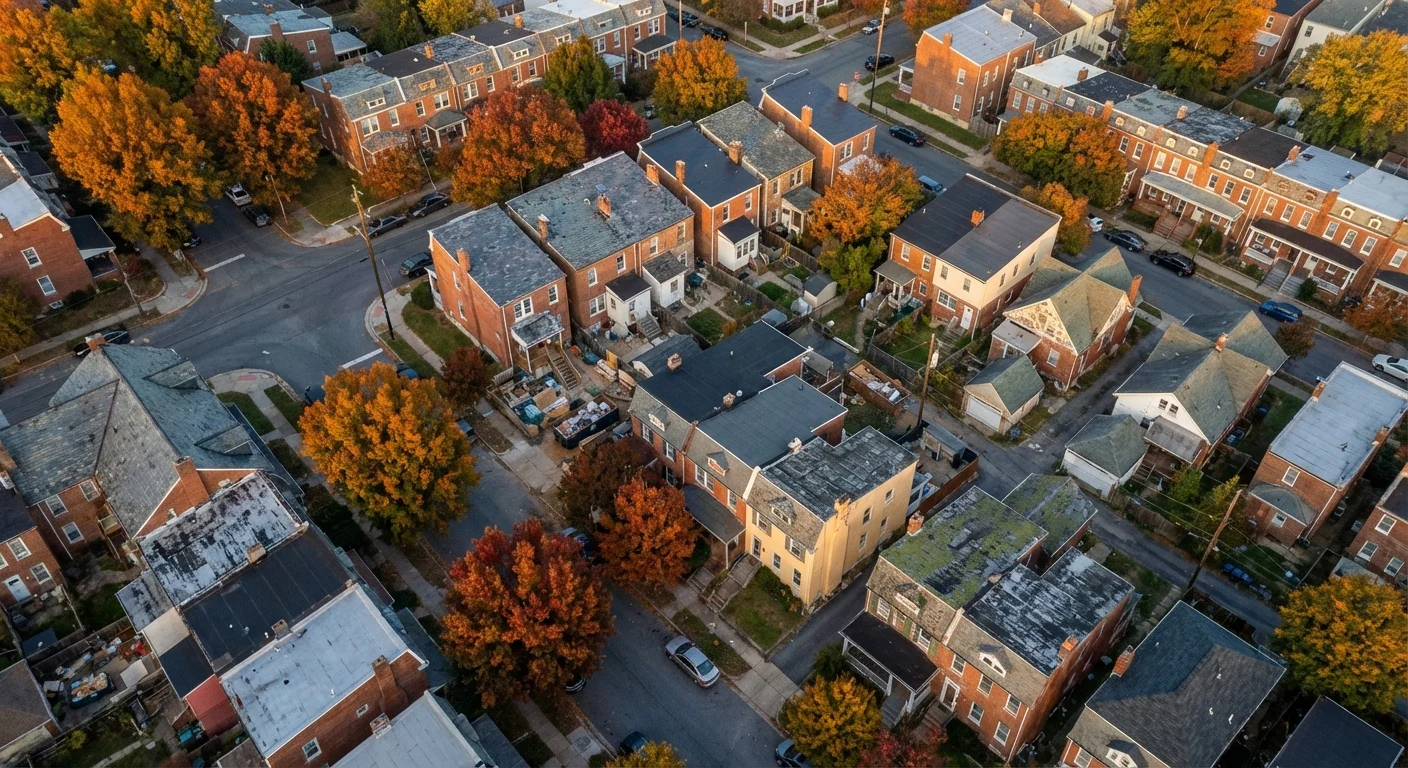
- Block-by-Block Evaluation in Baltimore and Beyond
- How Lenders Assess Neighborhood Risk Differently Than You Do
- Maryland Research Tools You Should Actually Use
- Good Neighborhood vs. Good Neighborhood for Flipping
Comparable Sales Density: The Foundation of Your ARV
Your after-repair value is only as good as the comps supporting it. I cannot stress this enough. When an investor submits a deal to me and the ARV is based on two sales from 8 months ago, one of which is half a mile away in a different school district, that is not comparable. That is speculation.
Comp density means the number of recent, relevant, renovated property sales within a tight geographic radius. In Baltimore City, I want comps within a quarter mile (maybe even within 1 block). In suburban counties, you might stretch to half a mile although ideally staying in the same subdivision. But the key word is RECENT.
I am looking at 30 to 90 day closed sales of renovated properties that mirror what your finished product will be. Not asking prices. Not pending sales. Closed transactions. Its important to review active listings as well so you can see what competition you might need to compete with.
If a neighborhood only has one or two renovated sales in the past six months, the ARV is speculative. There is not enough market evidence to support a confident valuation. Lenders get nervous in that scenario because the exit depends on a price point the market has barely validated.
Compare that to a neighborhood where you can pull 6-8 solid comps within 90 days. That tells you the market is active, buyers are paying those prices, and your finished product has a proven audience.
The comp analysis has to account for property type. A renovated three-bedroom rowhouse in Canton is not comparable to a renovated single-family detached home in Towson. Even within the same zip code, row homes trade on different fundamentals than detached houses. Square footage matters, but so does lot type, parking, and the specific block the property sits on.
Days on Market Trends: Reading the Velocity
The average days on market for renovated flips in your target area tells you how fast the exit will happen. This directly impacts your carrying costs, your profit margin, and honestly your stress level. In neighborhoods like Canton or Federal Hill, renovated properties typically move in 28 to 32 days while the broader Baltimore City average sits around 40. That gap matters.
But the raw DOM number is only half the story. The TREND is what I really care about. Pull DOM data for the last six months and compare it to the six months before that. If renovated properties were selling in 35 days last summer and now they are taking 55 days, something shifted.
Maybe buyer demand cooled. Maybe too many flippers flooded the market simultaneously. Maybe interest rates ticked up and pushed marginal buyers out. Whatever the cause, rising DOM is a warning sign that your exit timeline needs adjusting.
Falling DOM tells the opposite story. A neighborhood where velocity is increasing means demand is outpacing supply. That is where you want to be buying. I have seen investors lock in a property purchase right as DOM trends start dropping and ride that momentum straight through to a quick, profitable sale.
One detail a lot of investors might overlook: DOM varies by price point within the same neighborhood. A $350,000 renovated rowhouse might move in 30 days because it hits the first-time buyer sweet spot. That same block’s $550,000 product could sit for 70 days because fewer buyers qualify at that price. Know which price tier your finished product will land in and pull DOM specifically for that range.
Price Trajectory Over 12 to 24 Months
A neighborhood can have many comparable sales and fast DOM but still be a bad flip if prices are trending flat or declining. When price appreciation works in your favor or stable, thats ideal but there are still opportunities in mildly declining areas. Pull the median sale price for renovated properties over the past 12 months and compare it to the 12 months before that. Break it down monthly or quarterly.
Appreciating neighborhoods give you a margin of safety. If prices rose 5% over the past year, a project that takes six months to complete and sell might benefit from additional appreciation during that window. Flat or declining neighborhoods eliminate that cushion entirely. Every month your project takes is a month where values could erode further.
In the Maryland market right now, the picture varies dramatically by location. Frederick County has shown modest but steady appreciation. Parts of Baltimore City, particularly neighborhoods experiencing active renovation activity like Station North and Greenmount West, are seeing stronger upward movement. PG County submarkets closer to DC tend to track with metro area trends, which have been generally stable.
Do not confuse neighborhood-level trends with block-level reality. I have seen neighborhoods where the overall median is flat, but specific pockets within them are appreciating because one developer did a cluster of quality renovations that lifted the entire block. That granularity matters. Redfin market data for Baltimore can help you track these price movements at a neighborhood level over time.
Absorption Rate: How Fast Is Inventory Moving
Absorption rate measures how quickly available inventory is being consumed by the market. You calculate it by dividing the number of sold properties in a given period by the total active listings. A healthy market for flippers typically shows less than four months of supply. Anything above six months means inventory is piling up and sellers are competing against each other for a smaller pool of buyers.
For fix and flip specifically, you want to narrow this calculation to renovated properties in your target price range and micro market. The overall neighborhood absorption rate might look healthy, but if there are eight renovated flips sitting on the market simultaneously and only two sold last month, your specific product type has a four-month supply problem even if the broader market looks fine.
I use absorption rate as a timing indicator. A tightening absorption rate, meaning supply is dropping and sales velocity is increasing, signals a good entry point. A loosening rate means the market is softening and you should factor longer hold times into your budget. This metric is particularly useful in suburban Maryland markets like Anne Arundel County and Howard County where inventory fluctuations happen in waves tied to seasonal demand and new construction activity.
Rental Demand as Your Backup Exit Strategy
Every serious flipper needs a Plan B. If the property does not sell at your target ARV within a reasonable timeframe, can you refinance into a long-term rental and cash flow? This is the BRRRR contingency, and it should inform every acquisition decision.
Check rental comps the same way you check sale comps. What are renovated two and three bedroom units renting for in that specific area? In Baltimore City, average rents sit around $1,623 per month. But in stronger neighborhoods like Station North, renovated two-bedrooms command around $2,000 and three-bedrooms push past $2,200.
That rental income needs to cover your refinanced mortgage payment, property taxes, insurance, maintenance reserves, and vacancy allowance with room left over.
Baltimore City’s property tax rate of 2.25% is roughly double Baltimore County’s 1.10%. That tax difference is a major factor in rental cash flow analysis. A $350,000 City property carries about $7,870 in annual taxes versus $3,850 in the County. Run the numbers both ways before you commit.
The vacancy rate matters too. Markets with rental vacancy below 5% indicate strong tenant demand. Higher vacancy means you could sit with an empty unit burning cash while you search for a tenant. Neighborhoods with good transit access and proximity to hospitals, universities, or major employers tend to hold rental demand even during broader market softness.
Block-by-Block Evaluation in Baltimore and Beyond
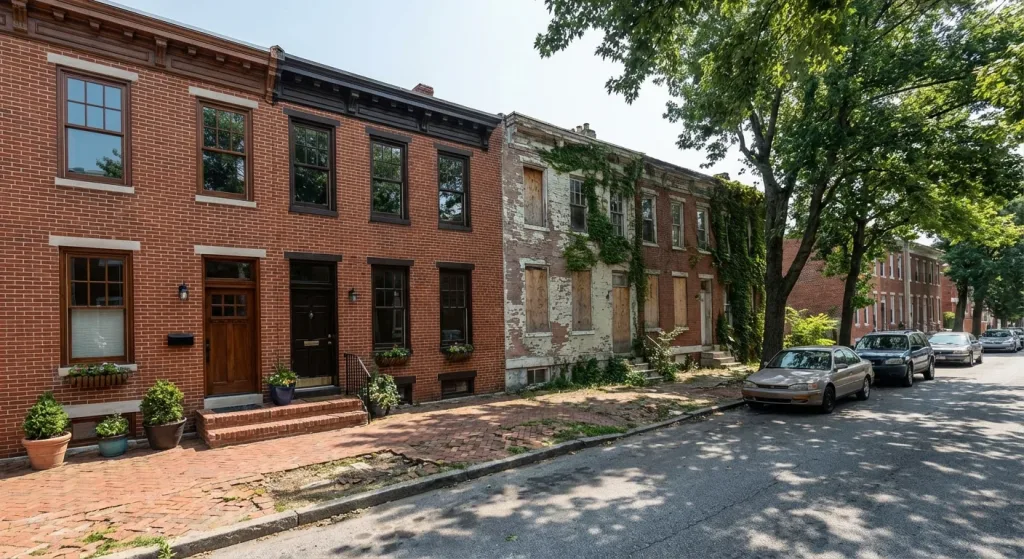
This is where Maryland investing gets genuinely different from most other markets. In Baltimore City, the block you are on matters more than the neighborhood you are in. I have personally seen a beautifully renovated rowhouse sell for $425,000 on one block while a nearly identical product two streets over struggled to close at $310,000.
Same neighborhood name. Same zip code. Completely different micro market.
The block-level evaluation starts with a physical drive. Park your car and walk the block. Count the renovated homes versus the vacant or boarded properties. Look at the condition of the streetscape, the neighboring stoops, whether cars are parked or abandoned.
Talk to residents if you can. The feel of a block tells you things data cannot.
Then confirm what you saw with data. Pull the last 6 months of sales on that specific block and the immediately adjacent blocks. If three homes sold renovated on your target block in the past year, you have evidence. If the closest renovated sale is four blocks away across a major road, you might be pioneering, and pioneering is expensive.
In PG County, similar micro market dynamics exist. A single-family home in Bowie trades on completely different fundamentals than one in Hyattsville, even though both are Prince George’s County. Bowie buyers are typically families seeking larger lots and good schools. Hyattsville buyers skew younger, attracted by Metro access and proximity to DC.
The renovation scope, finish level, and pricing strategy should reflect which buyer you are targeting. Getting this wrong means building the wrong product for the wrong audience.
CHAP Historic Districts: Know Before You Buy
Baltimore’s Commission for Historical and Architectural Preservation oversees dozens of historic districts throughout the city. If your target property sits in a CHAP district, exterior modifications need approval before work begins. That means your renovation timeline extends, your material choices may be constrained, and your budget needs to account for compliance requirements.
The upside is significant though. CHAP properties qualify for a 10-year property tax credit on the increased assessment value after renovation. Maryland also offers a state income tax credit equal to 20% of qualified rehabilitation expenses, capped at $50,000 over 24 months.
For investors planning to hold a CHAP property as a rental, these credits can dramatically improve long-term returns. For flippers, the tax credit transfers to the buyer, which can be a genuine selling point.
How Lenders Assess Neighborhood Risk Differently Than You Do
Investors evaluate neighborhoods based on profit potential. Lenders evaluate neighborhoods based on recovery risk. That distinction changes everything about what I look at. When I underwrite a bridge loan, I am asking one fundamental question: if this borrower defaults and I have to take this property back, can I recover my capital?
That means I care about marketability, not just value. A property in an up-and-coming neighborhood with thin comp support might have fantastic upside potential, but if I have to foreclose and sell it, thin comps means uncertain recovery. I would rather fund a deal in a boring, stable neighborhood with deep comp support and moderate margins than a speculative play in a transitional area where the ARV is based on hope.
Lenders stress-test the ARV. If the borrower says the ARV is $400,000, I want to know what happens if it is really $360,000. Does the deal still have enough equity to cover my loan plus foreclosure costs plus holding costs during a forced sale? Hard Money Lenders typically lend up to 65% LTV on the ARV, to ensure they have a margin of safety if the property can’t sell at top dollar.
This is why the underwriting process at a legitimate hard money shop is more neighborhood-focused than most borrowers realize.
Flood zone status is another lender concern that investors sometimes overlook. Properties in FEMA-designated flood zones require flood insurance, which can add thousands in annual carrying costs. Worse, properties with flood history can be difficult to resell.
About 40% of flood insurance claims actually come from properties OUTSIDE designated flood zones. I always check Maryland’s flood map database regardless of what the seller discloses.
Maryland Research Tools You Should Actually Use
Beyond the MLS and standard real estate portals, Maryland offers some powerful research tools that most investors never touch.
Maryland Land Records at mdlandrec.net gives you access to recorded deeds, liens, and ownership history for any property in the state. You can trace the chain of title, see what the current owner paid, and identify any recorded claims against the property. This is free to search and it is the same system title companies use.
County assessment offices provide tax assessment data, which is not the same as market value but gives you a baseline. The records show land value versus improvement value, zoning classification, lot dimensions, and building characteristics. When you are evaluating a neighborhood, pulling assessment data for the entire block reveals patterns.
A block where assessments are rising signals that the county is recognizing increased property values. This typically lags actual market appreciation by a year or two, which means rising assessments confirm a trend that already started.
Baltimore City’s permit and code violation database shows you which properties have active renovation permits, which have unresolved code violations, and which are tagged as vacant. A cluster of active renovation permits on a block is a strong signal that other investors see potential there. That validates your thesis. But if your target block has stacked code violations and no permits, investor interest might be minimal for a reason.
Good Neighborhood vs. Good Neighborhood for Flipping
This distinction trips up new investors constantly. Bethesda is a good neighborhood. Beautiful homes, great schools, excellent amenities. But is it a good neighborhood for flipping?
The margins are razor thin. Purchase prices are high, renovation costs are high because buyer expectations are extreme, and the spread between acquisition cost and ARV often does not justify the risk and capital required.
The best neighborhoods for flipping typically sit in that middle band. Not the most expensive areas where margins get compressed. Not the cheapest areas where buyer demand is uncertain. Look for neighborhoods where the median renovated sale price falls between $250,000 and $500,000 in Maryland, where comp density is strong, where DOM is under 45 days, and where the acquisition to ARV spread supports a minimum 15 to 20% gross margin after renovation costs.
Also consider your competition. If eight other flippers are all working the same three blocks in Hampden right now, absorption rate for renovated products on those blocks might be oversaturated even though the broader neighborhood data looks healthy. Drive the area. Count the dumpsters. Count the contractor vans. That on-the-ground intelligence is worth more than any spreadsheet.
Putting the Framework Together
Before you make an offer on any Maryland property, run through this checklist. Pull renovated comps within a quarter mile for city properties, half mile for suburban. Verify you have at least four to six solid comps within 90 days. Check the DOM trend for your specific price tier over the past six months.
Confirm price trajectory is flat or appreciating over 12 to 24 months. Calculate absorption rate for renovated product in that micro market. Run rental comps as your Plan B exit. Drive the block physically and check CHAP status, flood zone maps, and assessment records.
If the neighborhood passes all of those filters, you have a fundable deal that a lender will take seriously. If it fails on two or more, reconsider. The property might still work, but you need to understand exactly which risks you are accepting and price them into your offer accordingly.
Use the free deal analyzer to stress-test your numbers once you have gathered this neighborhood data. It will help you see whether the spread holds up when you plug in realistic carrying costs, realistic DOM timelines, and a conservative ARV based on actual comp density.
If you are ready to move on a deal and want to talk through the neighborhood analysis with someone who has seen thousands of these transactions across Maryland, submit a loan application. There is no cost and no obligation. Or browse the full breakdown of how Maryland hard money lending works if you are still in the research phase.
The information provided here is for educational purposes only and does not constitute financial or investment advice. Always perform your own due diligence and consult with qualified professionals before making investment decisions.